Plot time series in the style of the California Current IEA. Dashed lines are
used in between missing data and points colored by color_pts. Include a
ribbon around y if low (y_lo) and high (y_hi) values are provided.
Include long-term average if add_avg = TRUE with average as a black
dashed line and solid lines indicating the standard deviation in the color
of color_avg. Include rectangle in the color of color_avg between the
standard deviation of the long-term average since x_recent if provided.
Include icons in the right-hand margin for recent trend (→, ↗, ↘) and
recent average (o, +, -) if stable, increasing, or decreasing (respectively)
relative to the long-term standard deviation.
plot_ts(
  d,
  x = year,
  y = index,
  y_lo = SElo,
  y_hi = SEup,
  x_recent = 5,
  units_recent = "years",
  add_avg = TRUE,
  add_icons = TRUE,
  font_size = 24,
  icon_size = font_size/2,
  color_pts = rgb(225, 118, 44, max = 255),
  color_avg = rgb(63, 173, 213, max = 255),
  color_hilo = "lightgrey",
  alpha_avg = 0.8,
  alpha_hilo = 0.8,
  theme_plot = theme_iea
)
Arguments
- d
Default dataset to use for plotting with
ggplot2::ggplot(). Typically includes columns:year,index,SEloandSEup.- x
column for x axis from
d, unquoted. Defaults toyear.- y
column for y axis from
d, unquoted. Defaults toindex.- y_lo
unquoted column for low value to apply to gray ribbon, typically
y - sd(y). Defaults toSEloif present.- y_hi
unquoted column for highy value to apply to gray ribbon, typically
y + sd(y). Defaults toSEhiif present.- x_recent
duration of
x, typically an integer, for which to consider as recent period to derive rectangle and icons. Defaults to5, as in years.- units_recent
units to describe
x, used in caption.- add_avg
whether to add average as a black dashed line and solid lines indicating the standard deviation in the color of
color_avg. Defaults toTRUE.- add_icons
whether to include icons in the right-hand margin for recent trend (→, ↗, ↘) and recent average (o, +, -) if stable, increasing, or decreasing (respectively) relative to the long-term standard deviation. Defaults to
TRUE.- font_size
font size. Defaults to 24.
- icon_size
size of icon font. Defaults to half the
font_size, 12.- color_pts
color for points, as named color (see
colors()) or hexadecimal value as provided by red green bluergb()specification. Defaults to dusty orange.- color_avg
color for standard deviation lines around long-term average and rectangle between since
x_recent.- color_hilo
color for ribbon around
ybetween valuesy_loandy_hi.- alpha_avg
transparency (0 to 1) for colored elements of long-term average: standard deviation and recent rectangle.
- alpha_hilo
transparency (0 to 1) for ribbon around
ybetween valuesy_loandy_hi.- theme_plot
theme function to apply to the ggplot. Defaults to
theme_iea.
Value
This function returns a ggplot object with attributes for: caption,
recent_trend and recent_avg.
Details
The attribute caption includes a textual summary.
Examples
# example time series dataset with some NAs to show dashed line between non-NA values
ts1
#> # A tibble: 30 × 8
#> year index Y2 SElo SEup timeseries metric type
#> <dbl> <dbl> <dbl> <dbl> <dbl> <chr> <lgl> <chr>
#> 1 1986 1.95 1.95 -0.0482 3.95 (a) Trend and recent mean NA current.da…
#> 2 1987 1.63 1.63 -0.368 3.63 (a) Trend and recent mean NA current.da…
#> 3 1988 3.46 3.46 1.46 5.46 (a) Trend and recent mean NA current.da…
#> 4 1989 NA NA NA NA (a) Trend and recent mean NA current.da…
#> 5 1990 NA NA NA NA (a) Trend and recent mean NA current.da…
#> 6 1991 NA NA NA NA (a) Trend and recent mean NA current.da…
#> 7 1992 -1.02 -1.02 -3.02 0.983 (a) Trend and recent mean NA current.da…
#> 8 1993 1.53 1.53 -0.473 3.53 (a) Trend and recent mean NA current.da…
#> 9 1994 3.91 3.91 1.91 5.91 (a) Trend and recent mean NA current.da…
#> 10 1995 4.35 4.35 2.35 6.35 (a) Trend and recent mean NA current.da…
#> # … with 20 more rows
# defaults to include all options data frame contains x, y, SElo, SEhi
g <- plot_ts(ts1)
g
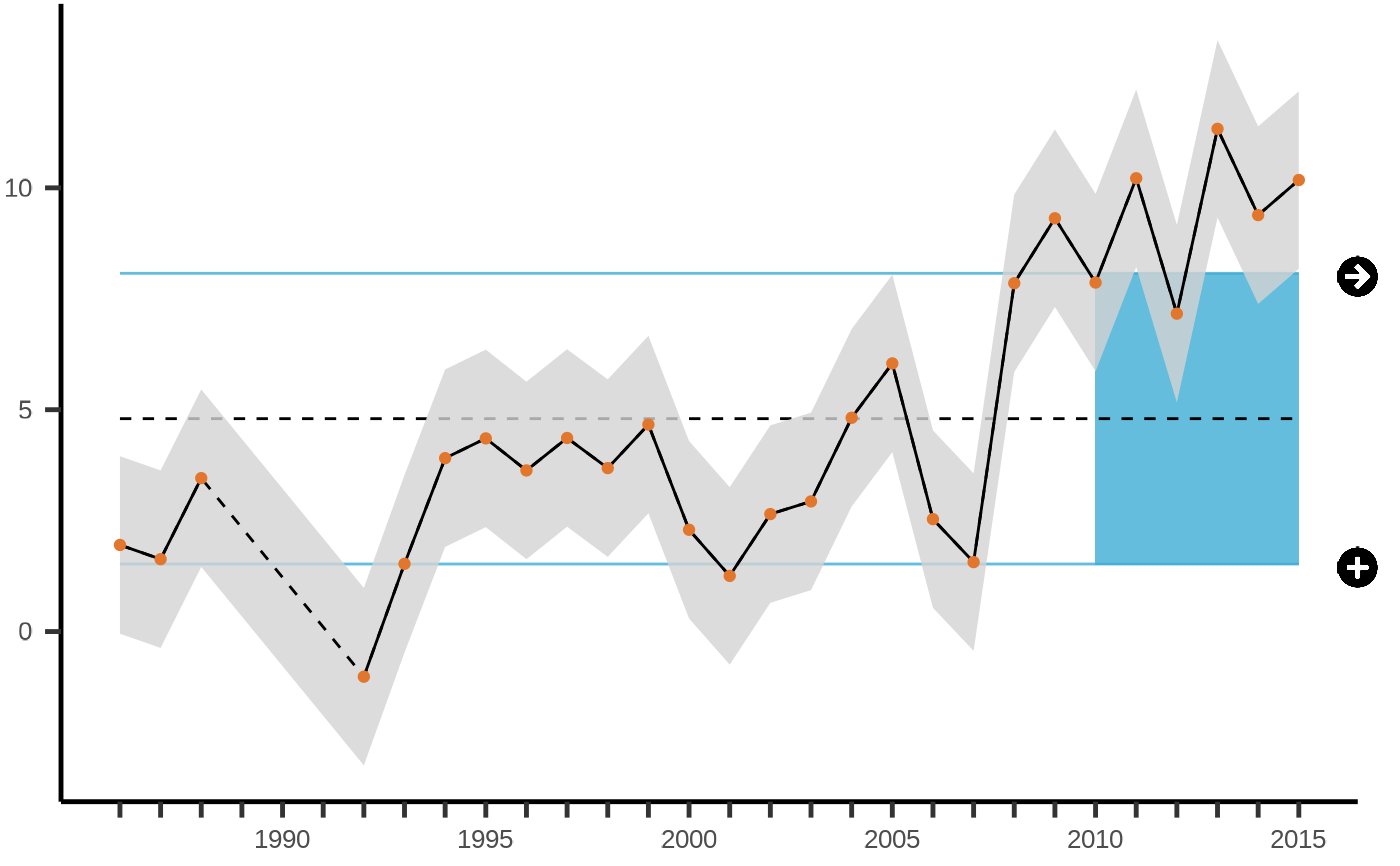 # show the caption attributed to the returned ggplot object
cat(attr(g, "caption"))
#> The index changed by less than one standard deviation of the full time series over the last 5 years (indicated by icon: →). The mean of the last 5 years was more than one standard deviation below the mean of the full time series (indicated by icon: +).
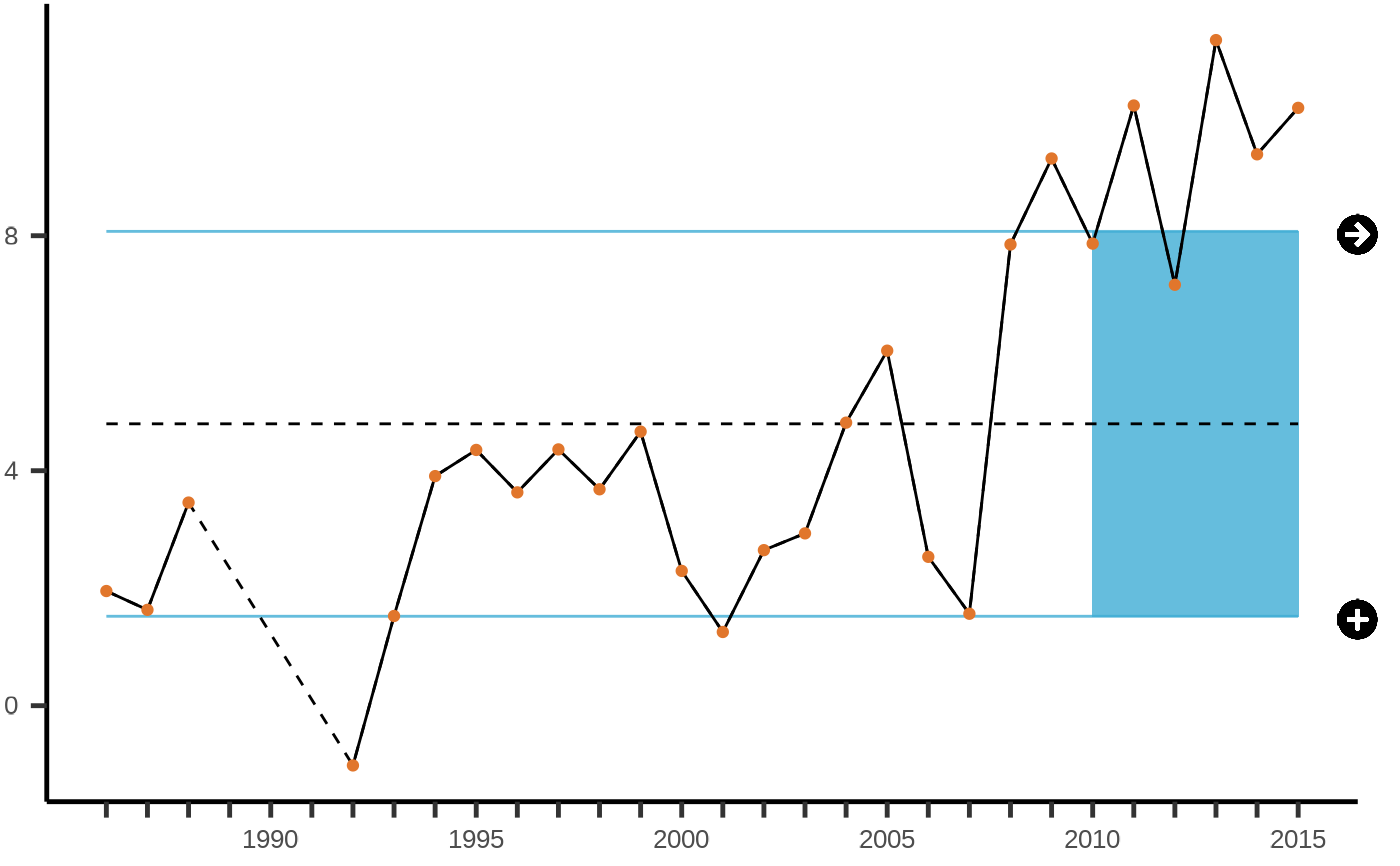
# without SElo or SEhi columns, just year and index
g <- plot_ts(ts1[,c("year","index")])
g
# show the caption attributed to the returned ggplot object
cat(attr(g, "caption"))
#> The index changed by less than one standard deviation of the full time series over the last 5 years (indicated by icon: →). The mean of the last 5 years was more than one standard deviation below the mean of the full time series (indicated by icon: +).
# without SElo or SEhi columns, just year and index
g <- plot_ts(ts1[,c("year","index")])
g
 # same caption as previously, since defaults to x_recent=5 and add_avg=T
cat(attr(g, "caption"))
#> The index changed by less than one standard deviation of the full time series over the last 5 years (indicated by icon: →). The mean of the last 5 years was more than one standard deviation below the mean of the full time series (indicated by icon: +).
# without default x_recent, add_avg, or add_icons
g <- plot_ts(ts1, x_recent=NA, add_icons=F, add_avg=F)
g
# same caption as previously, since defaults to x_recent=5 and add_avg=T
cat(attr(g, "caption"))
#> The index changed by less than one standard deviation of the full time series over the last 5 years (indicated by icon: →). The mean of the last 5 years was more than one standard deviation below the mean of the full time series (indicated by icon: +).
# without default x_recent, add_avg, or add_icons
g <- plot_ts(ts1, x_recent=NA, add_icons=F, add_avg=F)
g
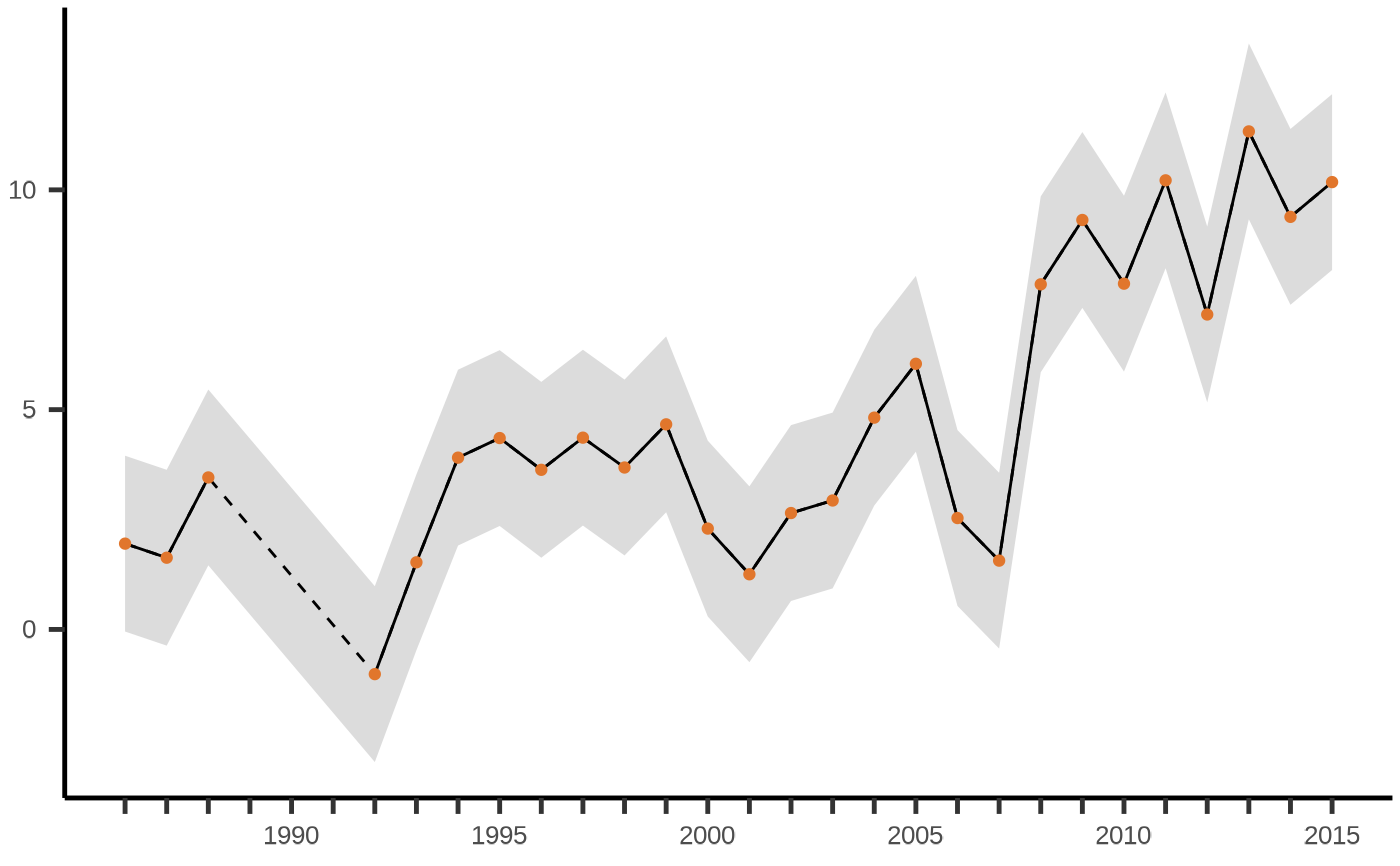 # no caption, since missing x_recent and add_avg
cat(attr(g, "caption")) # empty caption without x_recent
# no caption, since missing x_recent and add_avg
cat(attr(g, "caption")) # empty caption without x_recent