Here are all products listed alphabetically. Alternatively, you can browse by Technology, Region or from the menu.

Card image cap
Alaska Bering Sea Infographic
Infographic
Alaska

 website    details    code  

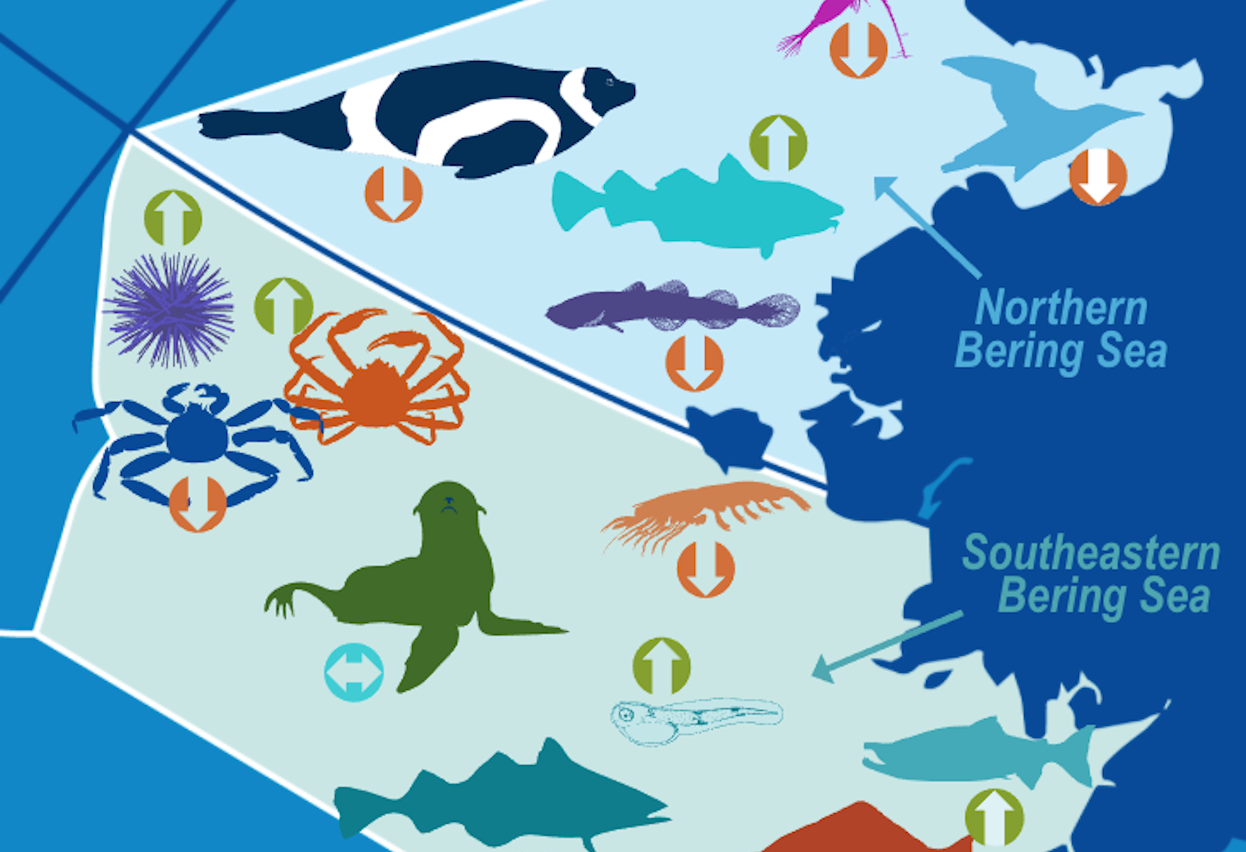
Conceptual diagram as interactive infographic for the 2018 Eastern Bering Sea Ecosystem Status Report: In Brief. .

Card image cap
Alaska Rare Species Map
App
Alaska

 website    details    code  

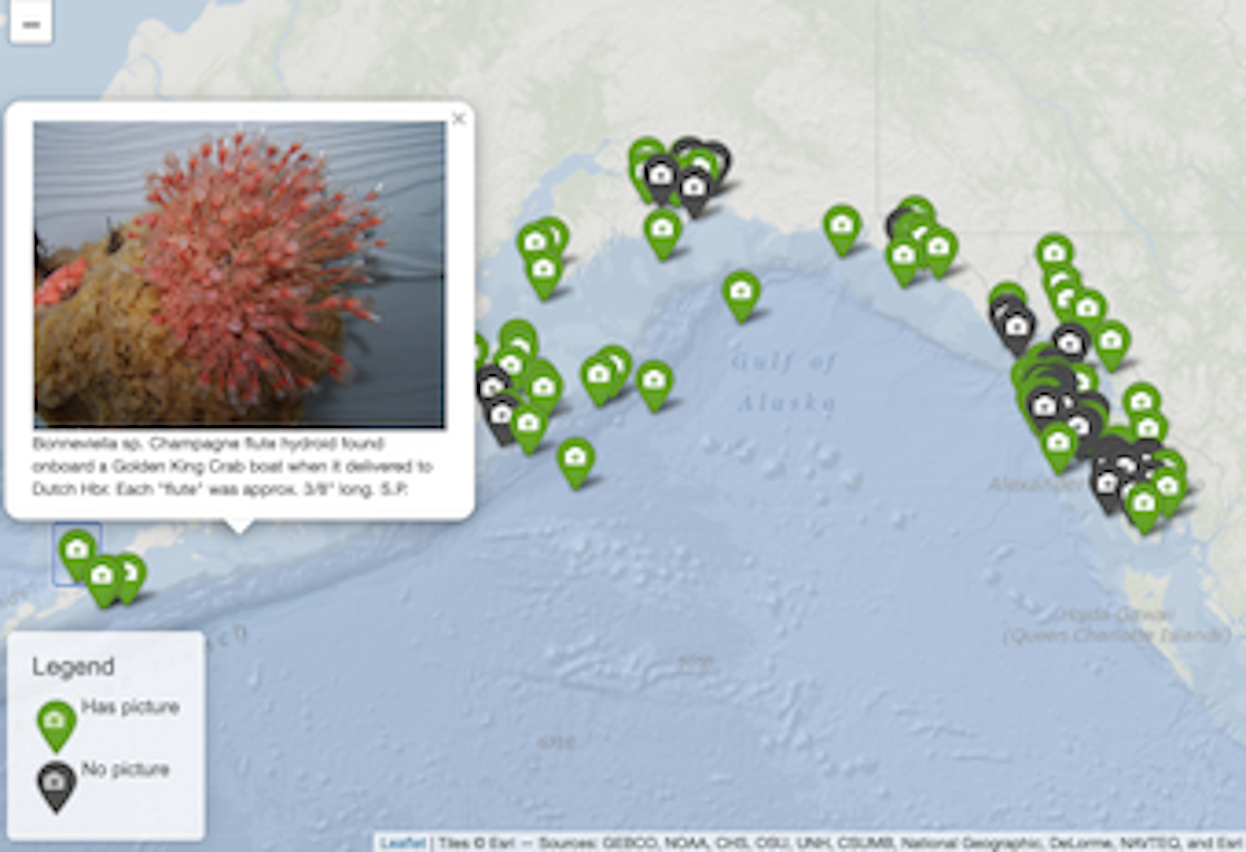
Gulf of Alaska rare species map from community.

Card image cap
Fisher Water Quality Monitoring in Florida
Dashboard
Gulf of Mexico

 website    details    code  

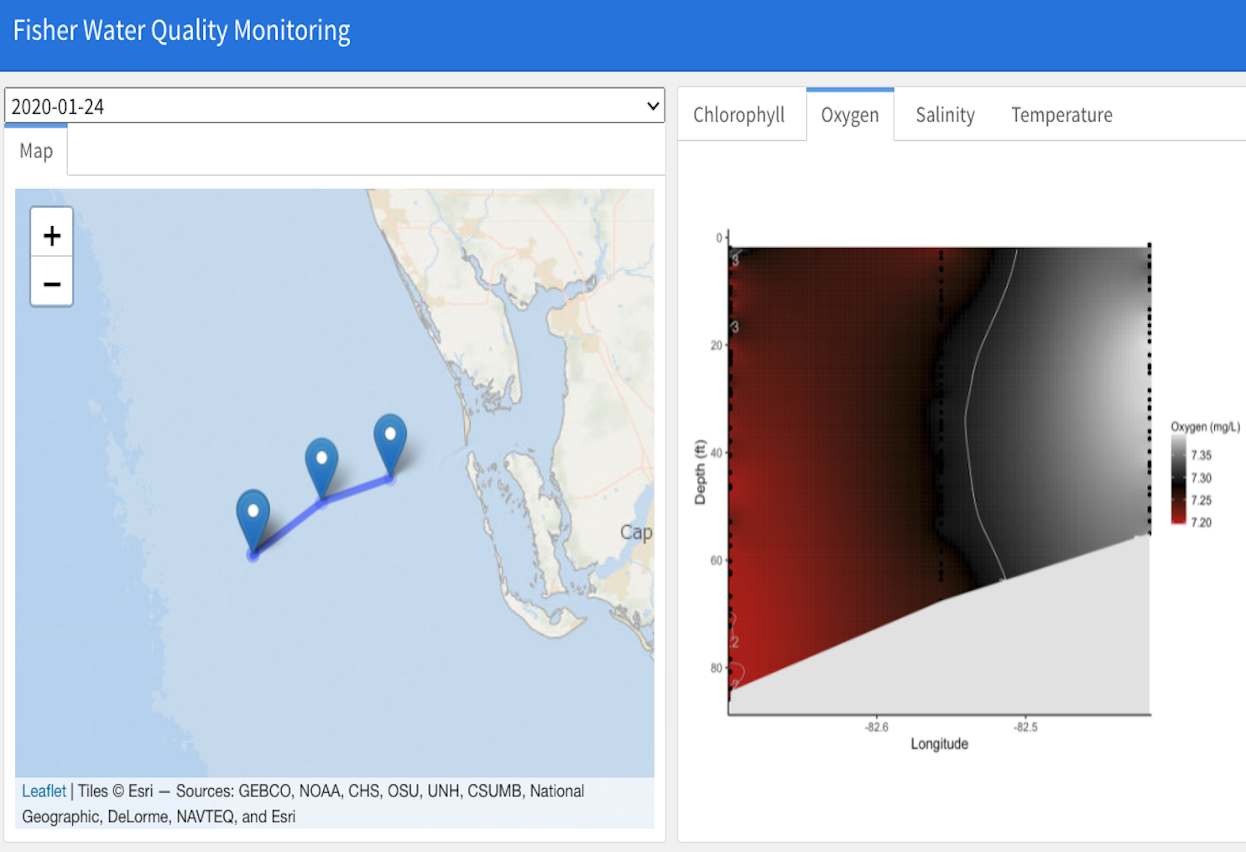
Dashboard to visualize water quality data collected by fishers to monitor for oxygen depleted zones.

Card image cap
Florida Keys ESR Infographic
Infographic
Gulf of Mexico

 website    details    code  

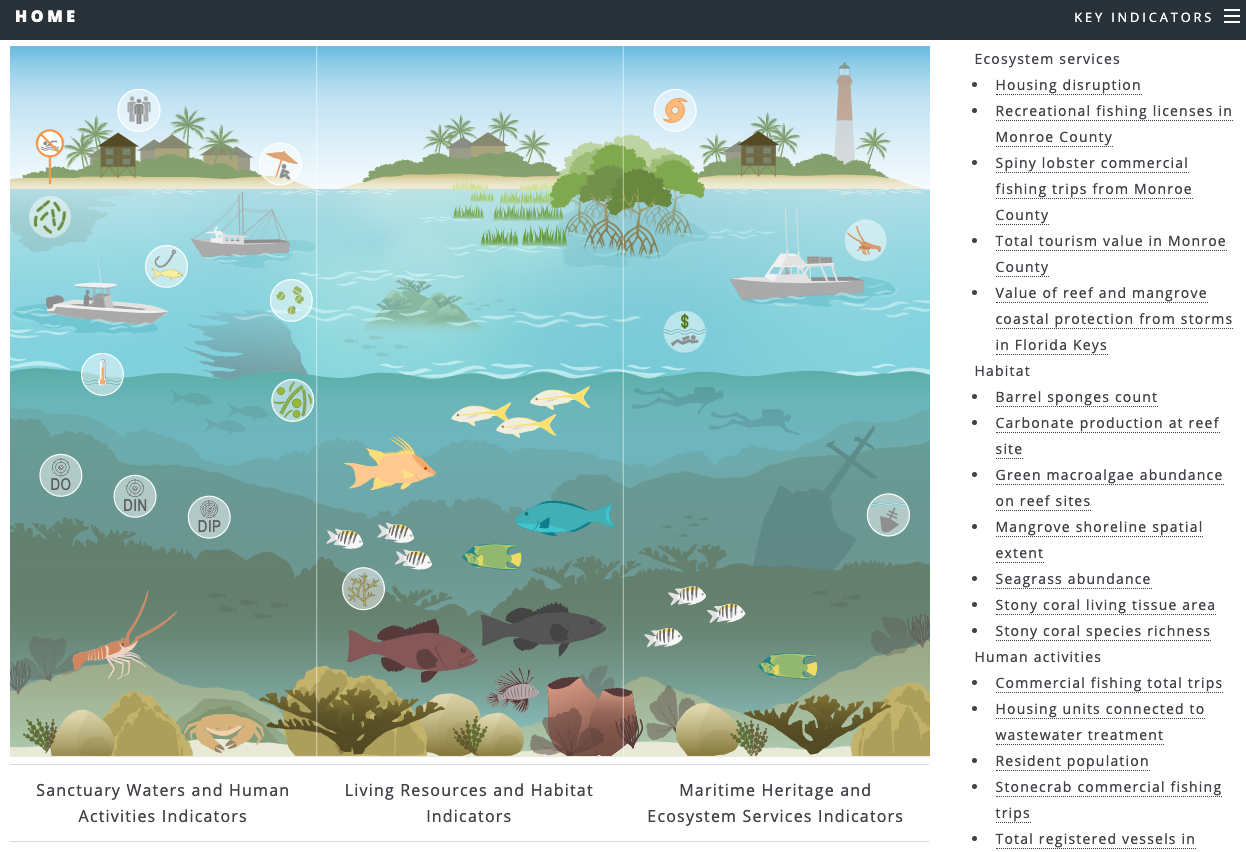
Conceptual diagram as interactive infographic for the Florida Keys Sanctuary associated with Ecosystem Status Report (ESR).

Card image cap
Reproducible Reporting with R
Training
All

 website    details    code  

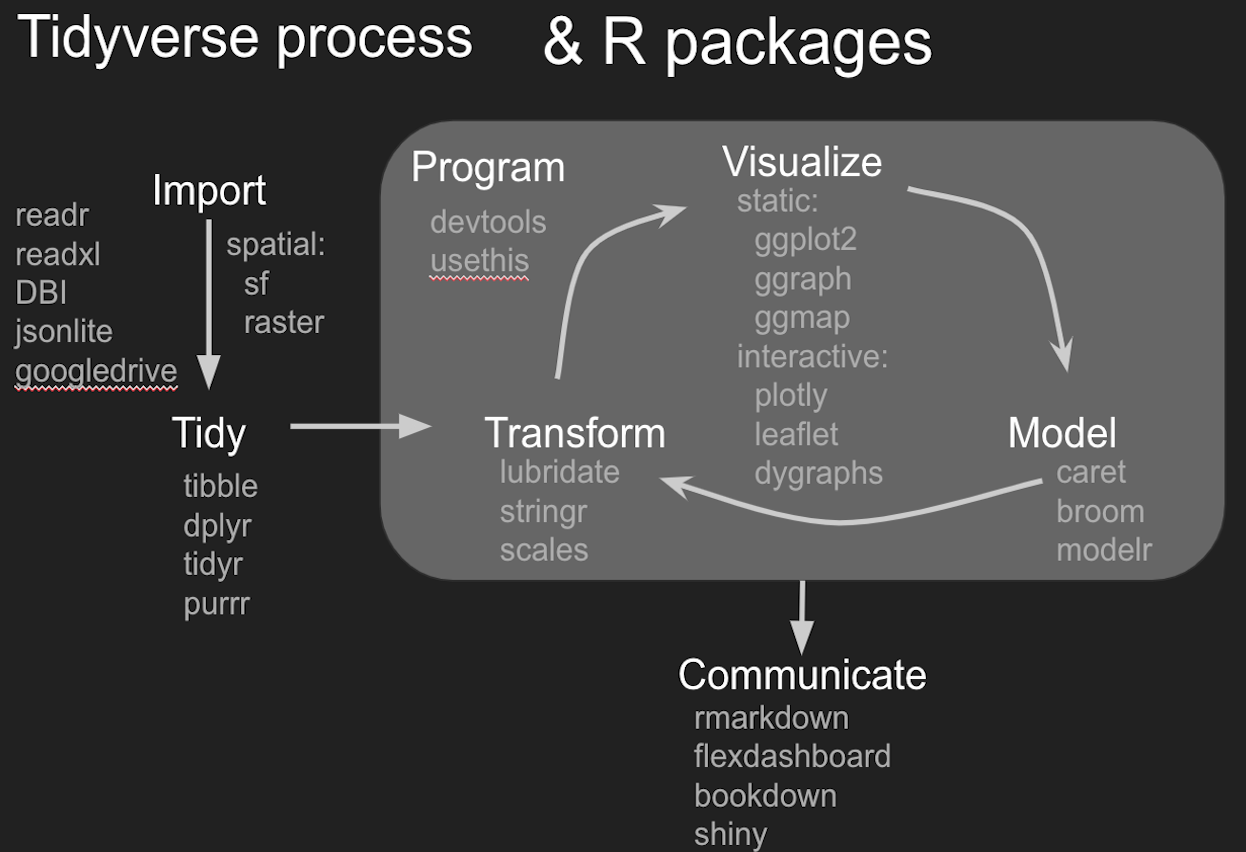
Free training series on Reproducible Reporting with R for marine ecological indicators.

Card image cap
Responsive Table for Data Visualization
Infographic
Northeast

 website    details    code  

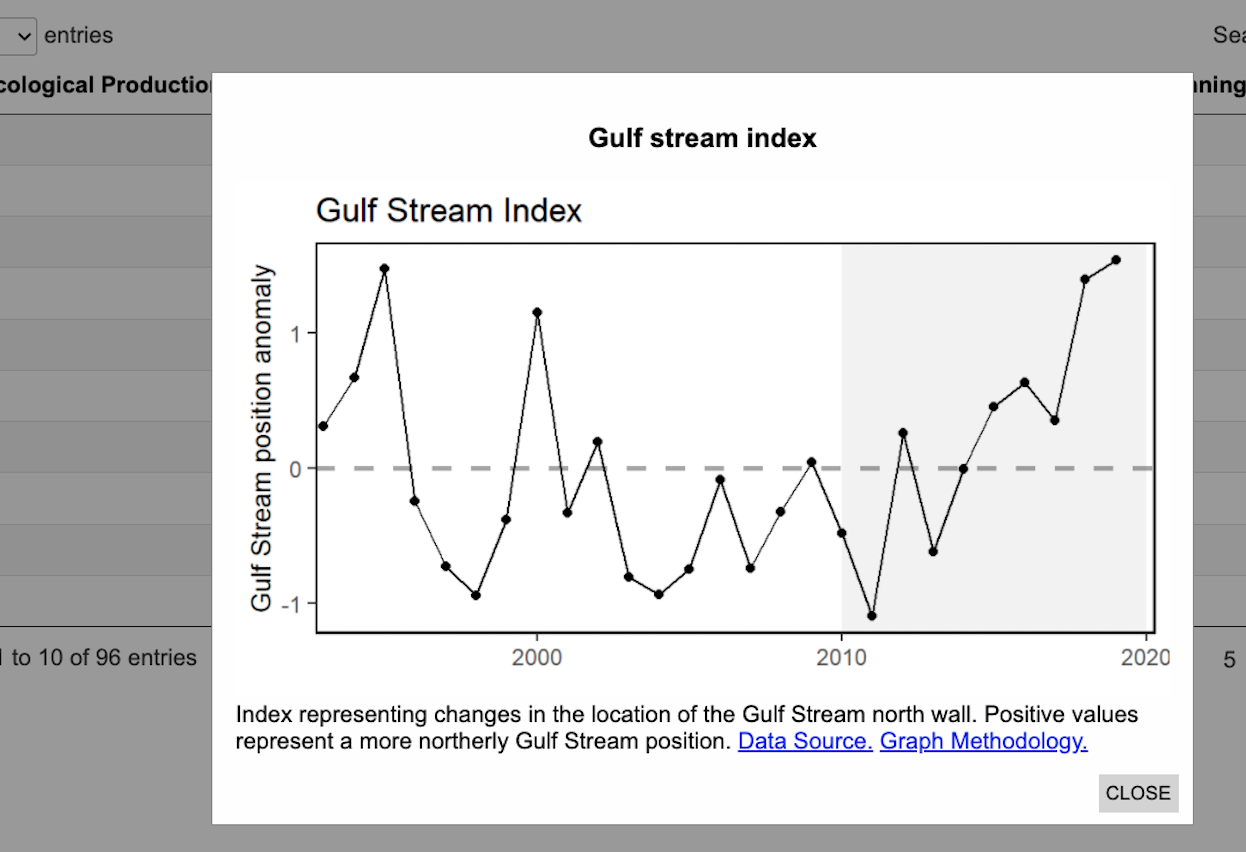
Responsive data tables for visualization of scientific diagrams.

Card image cap
Uploader
App
Northeast
 website    details    code    video  

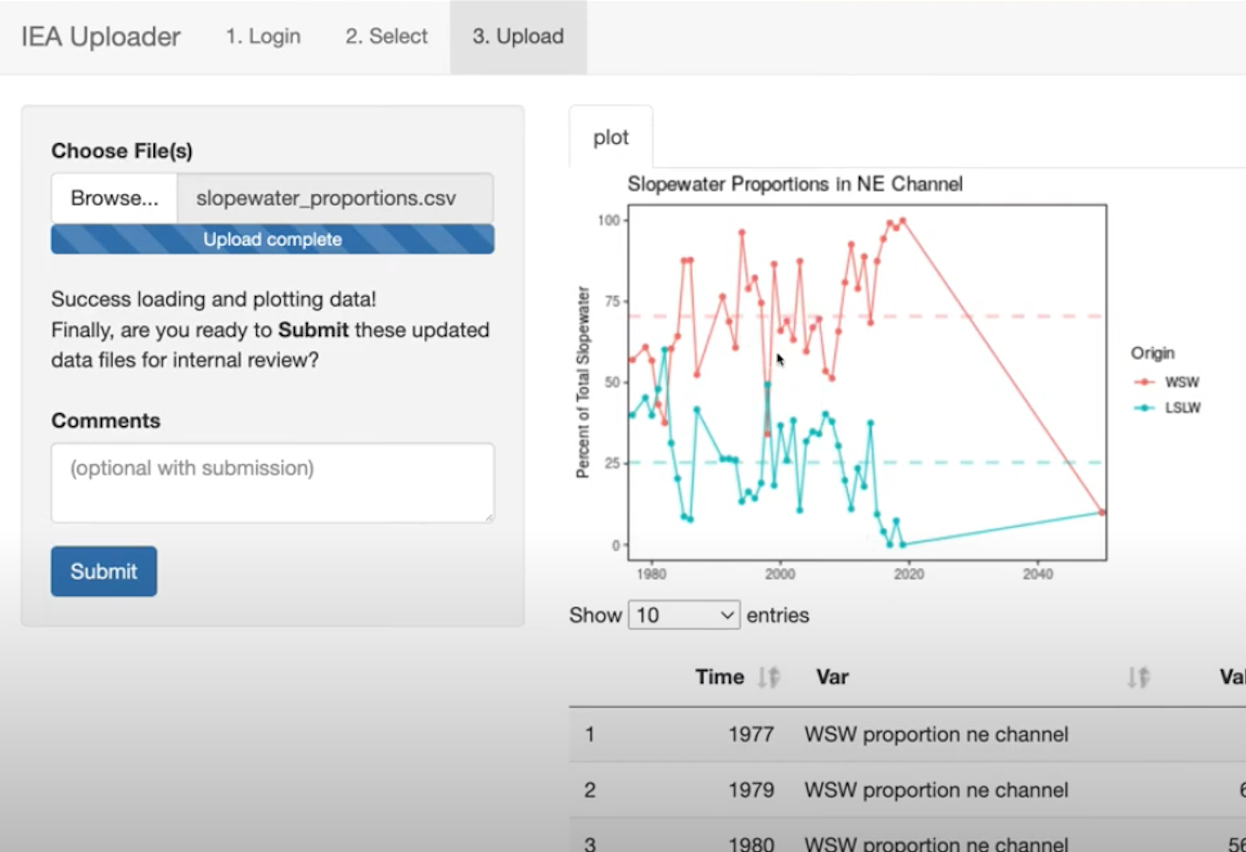
Shiny app to login via Google and update existing datasets with new data that are registered in the Northeast ecodata R package.